Adaptive Fibonacci Volatility Bands (AFVB)
**Adaptive Fibonacci Volatility Bands (AFVB)**
### **Overview**
The **Adaptive Fibonacci Volatility Bands (AFVB)** indicator enhances standard **Fibonacci retracement levels** by dynamically adjusting them based on market **volatility**. By incorporating **ATR (Average True Range) adjustments**, this indicator refines key **support and resistance zones**, helping traders identify **more reliable entry and exit points**.
**Key Features:**
- **ATR-based adaptive Fibonacci levels** that adjust to changing market volatility.
- **Buy and Sell signals** based on price interactions with dynamic support/resistance.
- **Toggleable confirmation filter** for refining trade signals.
- **Customizable color schemes** and alerts.
---
## **How This Indicator Works**
The **AFVB** operates in three main steps:
### **1️⃣ Detecting Key Fibonacci Levels**
The script calculates **swing highs and swing lows** using a user-defined lookback period. From this, it derives **Fibonacci retracement levels**:
- **0% (High)**
- **23.6%**
- **38.2%**
- **50% (Mid-Level)**
- **61.8%**
- **78.6%**
- **100% (Low)**
### **2️⃣ Adjusting for Market Volatility**
Instead of using **fixed retracement levels**, this indicator incorporates an **ATR-based adjustment**:
- **Resistance levels** shift **upward** based on ATR.
- **Support levels** shift **downward** based on ATR.
- This makes levels more **responsive** to price action.
### **3️⃣ Generating Buy & Sell Signals**
AFVB provides **two types of signals** based on price interactions with key levels:
✔ **Buy Signal**:
Occurs when price **dips below** a support level (78.6% or 100%) and **then closes back above it**.
- **Optionally**, a confirmation buffer can be enabled to require price to close **above an additional threshold** (based on ATR).
✔ **Sell Signal**:
Triggered when price **breaks above a resistance level** (0% or 23.6%) and **then closes below it**.
📌 **Important:**
- The **buy threshold setting** allows traders to **fine-tune** entry conditions.
- Turning this setting **off** generates **more frequent** buy signals.
- Keeping it **on** reduces false signals but may result in **fewer trade opportunities**.
---
## **How to Use This Indicator in Trading**
### 🔹 **Entry Strategy (Buying)**
1️⃣ Look for **buy signals** at the **78.6% or 100% Fibonacci levels**.
2️⃣ Ensure price **closes above** the support level before entering a long trade.
3️⃣ **Enable or disable** the buy threshold filter depending on desired trade strictness.
### 🔹 **Exit Strategy (Selling)**
1️⃣ Watch for **sell signals** at the **0% or 23.6% Fibonacci levels**.
2️⃣ If price **breaks above resistance and then closes below**, consider exiting long positions.
3️⃣ Can be used **alone** or **combined with trend confirmation tools** (e.g., moving averages, RSI).
### 🔹 **Using the Toggleable Buy Threshold**
- **ON**: Buy signal requires **extra confirmation** (reduces false signals but fewer trades).
- **OFF**: Buy triggers as soon as price **closes back above support** (more signals, but may include weaker setups).
---
## **User Inputs**
### **🔧 Customization Options**
- **ATR Length**: Defines the period for **ATR calculation**.
- **Swing Lookback**: Determines how far back to find **swing highs and lows**.
- **ATR Multiplier**: Adjusts the size of **volatility-based modifications**.
- **Buy/Sell Threshold Factor**: Fine-tunes the **entry signal strictness**.
- **Show Level Labels**: Enables/disables **Fibonacci level annotations**.
- **Color Settings**: Customize **support/resistance colors**.
### **📢 Alerts**
AFVB includes built-in **alert conditions** for:
- **Buy Signals** ("AFVB BUY SIGNAL - Possible reversal at support")
- **Sell Signals** ("AFVB SELL SIGNAL - Possible reversal at resistance")
- **Any Signal Triggered** (Useful for automated alerts)
---
## **Who Is This Indicator For?**
✅ **Scalpers & Day Traders** – Helps identify **short-term reversals**.
✅ **Swing Traders** – Useful for **buying dips** and **selling rallies**.
✅ **Trend Traders** – Can be combined with **momentum indicators** for confirmation.
**Best Timeframes:**
⏳ **15-minute, 1-hour, 4-hour, Daily charts** (works across multiple assets).
---
## **Limitations & Considerations**
🚨 **Important Notes**:
- **No indicator guarantees profits**. Always **combine** it with **risk management strategies**.
- Works best **in trending & mean-reverting markets**—may generate false signals in **choppy conditions**.
- Performance may vary across **different assets & timeframes**.
📢 **Backtesting is recommended** before using it for live trading.
Cari skrip untuk "swing high"

Intraday Anchored FanSimilar to an Anchored VWAP, this lets you click a bar on an Intraday chart to add an "Anchored Fan" which displays lines at up to 6 levels above and below the chosen Anchor Point. Useful to measure the retracement during swing moves.
You can reposition the fan by either hovering over the anchor or by clicking the name of the study to "activate" it, and then dragging. You can also change the Anchor Point in Settings.
By default the anchor uses the bar Close, but you can change this manually in settings OR you can use the fancy "Auto high/low" mode which is handy if you are mainly dropping the fan on local swing highs and lows.
The default line measures were chosen for ES (Futures) but the study should be usable with nearly anything as long as you adjust the settings to something appropriate for the ticker. If you want to use this on NQ, for example, it would be reasonable to multiple each of these settings by 3.5 or so.
NOTE: If the fan is off the left side of the chart, one way to see the Anchor handle again easily is to switch to a higher timeframe; for example if you are on the 5min maybe use the 15min or hourly to find the handle -- if it is WAY off the left side (for example if you let many days pass without advancing it) it's generally easiest to use Settings to move it back to "now".

VWAP Horizon Suite Optimized - CoffeeKillerVWAP Horizon Suite Optimized - User Guide
Overview
The VWAP Horizon Suite Optimized is a comprehensive technical analysis tool for TradingView designed to enhance your trading strategy with Volume Weighted Average Price (VWAP) analysis, standard deviation bands, and customizable Exponential Moving Averages (EMAs). This indicator provides a robust framework for identifying potential support and resistance levels, price momentum, and market trends.
Key Features
- **Daily VWAP with Session Reset**: Automatically resets at 17:00 (5:00 PM) each day
- **Customizable Standard Deviation/Percentage Bands**: Up to 3 bands above and below VWAP
- **High/Low Point Detection**: Visual markers for significant price levels
- **Multiple Customizable EMAs**: 8 different EMAs that can be individually toggled and styled
- **Visual Customization**: Adjustable colors, fills, and styles for all elements
VWAP Settings
- **Source**: Determines the price data used to calculate VWAP (default: HLC3 - High, Low, Close average)
Bands Settings
- **Bands Calculation Mode**: Choose between "Standard Deviation" or "Percentage" methods
- **Show Band #1, #2, #3**: Toggle visibility for each band
- **Band Multiplier #1, #2, #3**: Adjust the distance from VWAP (in standard deviations or percentage)
- **Show Fills**: Enable colored fills between bands for better visualization
Visualization Settings
- **Show High/Low Markers**: Display diamond markers for local high and low points relative to VWAP, these reset based on the price crossing the VWAP Line.
EMA Settings
The indicator provides 8 customizable EMAs (8, 13, 21, 26, 48, 50, 100, and 200) with individual controls:
- **Show EMA X**: Toggle visibility for each EMA
- **EMA X Period**: Adjust the period length for calculation
- **EMA X Color**: Customize the color of each EMA
- **EMA Line Width**: Set the width for all EMA lines
How to Use
Basic VWAP Analysis
The core VWAP line (blue) represents the average price weighted by volume since the start of the session (17:00 daily reset). This serves as a dynamic support/resistance level and reference point for intraday trading.
1. **Price above VWAP**: Generally bullish short-term sentiment
2. **Price below VWAP**: Generally bearish short-term sentiment
3. **Crosses of VWAP**: Potential shift in short-term momentum
Standard Deviation Bands
The bands surrounding VWAP help identify potential support, resistance, and volatility levels:
- **Band #1 (±1σ)**: Price often reverts to VWAP when reaching these levels
- **Band #2 (±2σ)**: Stronger support/resistance areas, possible reversal zones
- **Band #3 (±3σ)**: Extreme price levels, often indicating overbought/oversold conditions
High/Low Point Detection
Purple and yellow diamond markers identify significant swing highs and lows relative to VWAP, helping you recognize potential reversal points or continuation patterns. (These repaint in a effort to find the max high/low point from the VWAP Line)
EMA Strategy
The customizable EMAs can be used to:
- Find potential support/resistance levels
- Create crossover systems
- Analyze market structure
Common EMA combinations include:
- 8 & 21 for short-term trends
- 50 & 200 for long-term trends and the "Golden Cross/Death Cross"
- 13 & 48 for the "New Golden Cross" - a modern alternative gaining popularity among traders
- 8, 13, 21 for complex short-term momentum analysis
Advanced Usage Tips
For Day Traders
1. **Opening Range Analysis**: Watch how price reacts to VWAP in the first hour of trading
2. **VWAP Reversions**: Look for trades when price touches outer bands and reverses toward VWAP
3. **Band Breakouts**: Strong moves beyond Band #2 may indicate momentum for continuation
For Swing Traders
1. **Use alongside daily/weekly support-resistance levels**
2. **Combine with EMA crossovers for trend confirmation**
3. **Identify potential reversal zones where price reaches Band #3**
Combined Strategies
- **EMA + VWAP Confluence**: Strong signals occur when EMA lines and VWAP/bands align at the same price level
- **High/Low + Band Touch**: When a high/low marker appears near a band, it may indicate a stronger support/resistance level
Conclusion
The VWAP Horizon Suite Optimized provides a comprehensive set of tools for price analysis based on volume-weighted data and exponential averages. By understanding and properly configuring the various components, you can create a powerful visual framework for identifying potential trading opportunities across multiple timeframes.
Remember that no indicator provides perfect signals, and the VWAP Horizon Suite works best when used as part of a complete trading strategy that includes risk management, multiple confirmation tools, and proper analysis of market conditions.
DISCLAIMER
**DISCLAIMER: This indicator and its signals are intended solely for educational and informational purposes. They do not constitute financial advice. Trading involves significant risk of loss. Always conduct your own analysis and consult with financial professionals before making trading decisions.**

Enhanced BarUpDn StrategyEnhanced BarUpDn Strategy
The Enhanced BarUpDn Strategy is a refined price action-based trading approach that identifies market trends and reversals using bar formations. It focuses on detecting bullish and bearish momentum by analyzing consecutive price bars and key support/resistance levels.
Key Features:
✅ Trend Confirmation – Uses a combination of bar patterns and indicators (e.g., moving averages, RSI) to confirm momentum shifts.
✅ Entry Signals – A buy signal is triggered when an "Up Bar" (higher high, higher low) follows a bullish setup; a sell signal when a "Down Bar" (lower high, lower low) confirms bearish momentum.
✅ Enhanced Filters – Incorporates volume analysis and additional conditions to reduce false signals.
✅ Stop-Loss & Risk Management – Uses recent swing highs/lows for stop placement and dynamic trailing stops for maximizing gains.

Trend Vanguard StrategyHow to Use:
Trend Vanguard Strategy is a multi-feature Pine Script strategy designed to identify market pivots, draw dynamic support/resistance, and generate trade signals via ZigZag breakouts. Here’s how it works and how to use it:
ZigZag Detection & Pivot Points
The script locates significant swing highs and lows using configurable Depth, Deviation, and Backstep values.
It then connects these pivots with lines (ZigZag) to highlight directional changes and prints labels (“Buy,” “Sell,” etc.) at key turning points.
Support & Resistance Trendlines
Pivot highs and lows are used to draw dashed S/R lines in real-time.
When price crosses these lines, the script triggers a breakout signal (long or short).
EMA Overlays
Up to four EMAs (with customizable lengths and colors) can be overlaid on the chart for added trend confirmation.
Enable/disable each EMA independently via the settings.
Repaint Option
Turning on “Smooth Indicator Lines” (repaint) uses future data to refine past pivots.
This can make historical signals look cleaner but does not reflect true historical conditions.
Turning it off ensures signals remain fixed once they appear.
Strategy Entries & Exits
On each new ZigZag “Buy” or “Sell” signal, the script closes any open position and flips to the opposite side (if desired).
Works with the built-in TradingView Strategy engine for backtesting.
Additional Inputs (Placeholders)
Volume Filter and RSI Filter settings exist but are not fully implemented in the current code. Future versions may incorporate these filters more directly.
How to Use
Add to Chart: Click “Indicators” → “Invite-Only Scripts” (or “My Scripts”) and select “Trend Vanguard Strategy.”
Configure Settings:
Adjust ZigZag Depth, Deviation, and Backstep to fine-tune pivot sensitivity.
Enable or disable each EMA to see how it aligns with market trends.
Toggle “Smooth Indicator Lines” on or off depending on whether you want repainting.
Backtest and Forward Test:
Use TradingView’s “Strategy Tester” tab to review hypothetical performance.
Remember that repainting can alter past signals if enabled.
Monitor Live:
Watch for breakout triangles or ZigZag labels to identify potential reversal or breakout trades in real time.
Disclaimer: This script is purely educational and not financial advice. Always combine it with sound risk management and thorough analysis. Enjoy exploring the script, and feel free to experiment with the different settings to match your trading style!

Trending Market Toolkit [LuxAlgo]The Trending Market Toolkit focuses exclusively on trending market structures and high-confluence, high-risk-to-reward entry models. It is designed to complement discretionary trading by offering different entry strategies based on market structure.
🔶 USAGE
In the chart above we can see how the tool detects several reversals, draws the broken trendlines, the reversal areas from which the tool starts looking for a trigger, and when it finally happens, a potential trade with risk and reward areas and the risk/reward ratio.
🔹 Detection Mode
Traders can choose between three different modes: trend only, reversal only, or both.
If both are active, reversals have priority over trends, so the tool will not detect a trend if a reversal is active.
In the chart above we can see all three modes.
🔹 Detection on Higher Timeframes
Traders can choose to identify structures on the chart timeframe or on a higher timeframe.
In the chart above, we have the SP500 futures on the 5m timeframe with different settings: chart timeframe, 30m, and 1H.
🔹 Risk And Targets
Depending on whether the high-risk/reward parameter is enabled, traders can choose between three different targets and two different stops.
The chart above shows how different choices affect the risk/reward ratio for the same potential trade on the Gold Futures 2m chart.
🔶 SETTINGS
Show: Traders can choose between Trends, Reversals or Both.
🔹 Structures
Swing Length: Number of candles to confirm a swing high or swing low. A higher number detects larger swings.
Custom Timeframe: Traders can make use of the current chart timeframe, or choose a custom timeframe.
Reversal Area Threshold: A higher number increases the reversal area.
🔹 Trades
Trade Trigger Length: Number of candles to confirm an internal high or internal low. A lower number detects smaller swings. It must be the same size or smaller than the swing length.
Target: Traders can choose between the default target (0) or two extended targets (0.27 or 0.618).
Risk to Reward Threshold: Set the minimum risk-to-reward ratio to detect trades. Use the 0 value to detect all trades.
High Risk to Reward: Enable/Disable the high risk to reward mode.

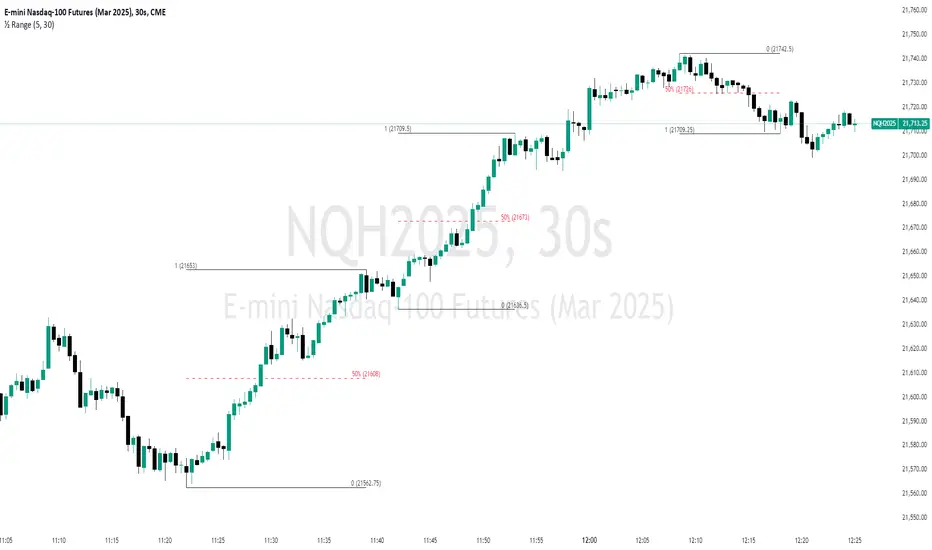
Unmitigated 50% of the RangeThis indicator is designed to display unmitigated 50% zones of price ranges within two swing (High and Low) points. The 50% level serves as a probable target for retracements before the price resumes its movement in the direction of the most recent swing. The underlying theory is that Price Action tends to correct unbalanced price zones by returning to 50% of the range.
The indicator identifies highs and lows utilizing the “Left Swing Sensitivity” setting, which detects the high/low points within the specified number of bars. It then ensures that the zone meets a minimum size requirement, configured via the “Minimum Leg Size” setting, to filter out smaller legs/zones that would not provide sufficient profit and loss opportunities for entries at 50% and take profit at the most recent swing point.
To prevent duplication of zones when the price is gradually moving up, an "Auto Adjust Levels" setting is available. Enabled by default, this feature automatically cleans up smaller zones, retaining only the primary zone between the most recent swing point and the outer swing.
Additionally, the indicator automatically removes mitigated zones where the price has returned to the 50% level, thus maintaining clean charts.
There are several visualization settings available, offering comprehensive control over what is displayed on the charts:
Control the color and style of the lines representing the 1, 0, and 50% levels.
Choose whether to display labels and if they should show the price at the rendered levels.
Optionally extend the lines/labels to the right for each level.
Auto Fibonacci Extension and Retracement with Visual AlertsThis indicator automatically calculates and plots Fibonacci retracement and extension levels based on recent swing highs and lows, making it a powerful tool for traders who use Fibonacci analysis in their strategies.
Key Features:
• Dynamic Fibonacci Levels: Automatically detects swing highs and lows over a user-defined lookback period to calculate key Fibonacci retracement (e.g., 0.236, 0.382, 0.618, etc.) and extension (e.g., 1.618, 2.618, etc.) levels.
• Visual Alerts: Displays intuitive visual alerts when the price crosses important Fibonacci levels.
• Blue dashed lines for retracement levels.
• Green dashed lines for extension levels.
• Labels with up or down arrows indicating price interactions with these levels.
• Swing High/Low Visualization: Marks recent swing highs and lows with crosses for better clarity.
• Customizable: Adjust the lookback period and Fibonacci levels to suit your trading style.
Who is it for?
This indicator is perfect for:
• Swing Traders: To identify potential reversal or continuation zones.
• Day Traders: For short-term setups based on Fibonacci levels.
• Fibonacci Enthusiasts: To automate the time-consuming process of manually plotting levels.
Usage Ideas:
1. Use retracement levels (e.g., 0.618) to identify areas of potential support or resistance.
2. Use extension levels (e.g., 1.618) to target potential breakout or continuation zones.
3. Combine this indicator with candlestick patterns, volume analysis, or other tools for confirmation.
Limitations:
• This is a standalone indicator and does not provide buy/sell signals. It’s recommended to combine it with other technical analysis tools for best results.
• The lookback period and swing detection rely on past data, so adjustments may be needed based on the asset or timeframe.
Whether you’re looking to streamline your Fibonacci analysis or explore new opportunities in your trading, this indicator is designed to save time, increase accuracy, and enhance your overall trading experience.

Detrended Price Oscillator [NexusSignals]Detrended Price Oscillator (DPO) is a detrended price oscillator, used in technical analysis, strips out price trends in an effort to estimate the length of price cycles from peak to peak or trough to trough.
DPO is not a momentum indicator, instead highlights peaks and troughs in price, which are used to estimate buy and sell points in line with the historical cycle. (cf. to investopedia)
DPO indicator made by NexusSignals components :
a filled area that allow users to see easy the trend of an asset;
a sma moving average on chart (default length is 20)
a 20 sma on oscillator, both ma's are color coded to show uptrend / downtrend
a donchian channel applied to the dpo to show breakouts, breakdowns and resistances/support, reversals
few alerts for price crossing above ma, cross above the 0 dpo line, and for cross above and below the donchian channels top and bottom
How you can use DPO indicator ?
The detrended price oscillator (DPO) can be used for measuring the distance between peaks and troughs in the indicator that may help traders to make future decisions as they can locate the most recent trough and determine when the next one may occur in the meassured distance on oscillator between peaks and troughs.
You can use the indicator to find the potential price reversals, for example when the price of an asset is in a bearish trend and the dpo is bouncing from the donchian channel bottom, that may be a potential swing low for that asset, same thing in a bullish trend when the dpo rejecting at top of donchian channel may be a trend reversal, a pullback or swing high.
When DPO is above the 0 trend is in an uptrend and when dpo is below the zero the asset is possible to move into a downtrend.
Also crosses of DPO above and below the DPO moving average may signalising a trend change.

ATT Model with Buy/Sell SignalsIndicator Summary
This indicator is based on the ATT (Arithmetic Time Theory) model, using specific turning points derived from the ATT sequence (3, 11, 17, 29, 41, 47, 53, 59) to identify potential market reversals. It also integrates the RSI (Relative Strength Index) to confirm overbought and oversold conditions, triggering buy and sell signals when conditions align with the ATT sequence and RSI level.
Turning Points: Detected based on the ATT sequence applied to bar count. This suggests high-probability areas where the market could turn.
RSI Filter: Adds strength to the signals by ensuring buy signals occur when RSI is oversold (<30) and sell signals when RSI is overbought (>70).
Max Signals Per Session: Limits signals to two per session to reduce over-trading.
Entry Criteria
Buy Signal: Enter a buy trade if:
The indicator displays a green "BUY" marker.
RSI is below the oversold level (default <30), suggesting a potential upward reversal.
Sell Signal: Enter a sell trade if:
The indicator displays a red "SELL" marker.
RSI is above the overbought level (default >70), indicating a potential downward reversal.
Exit Criteria
Take Profit (TP):
Define TP as a fixed percentage or point value based on the asset's volatility. For example, set TP at 1.5-2x the risk, or a predefined point target (like 50-100 points).
Alternatively, exit the position when price approaches a key support/resistance level or the next significant swing high/low.
Stop Loss (SL):
Place the SL below the recent low (for buys) or above the recent high (for sells).
Set a fixed SL in points or percentage based on the asset’s average movement range, like an ATR-based stop, or limit it to a specific risk amount per trade (1-2% of account).
Trailing into Profit
Use a trailing strategy to lock in profits and let winning trades run further. Two main options:
ATR Trailing Stop:
Set the trailing stop based on the ATR (Average True Range), adjusting every time a new candle closes. This can help in volatile markets by keeping the stop at a consistent distance based on recent price movement.
Break-Even and Partial Profits:
When the price moves in your favor by a set amount (e.g., 1:1 risk/reward), move SL to the entry (break-even).
Take partial profit at intermediate levels (e.g., 50% at 1:1 RR) and trail the remainder.
Risk Management for Prop Firm Evaluation
Prop firms often have strict rules on daily loss limits, max drawdowns, and minimum profit targets. Here’s how to align your strategy with these:
Limit Risk per Trade:
Keep risk per trade to a conservative level (e.g., 1% or lower of your account balance). This allows for more room in case of a drawdown and aligns with most prop firm requirements.
Daily Loss Limits:
Set a daily stop-loss that ensures you don’t exceed the firm’s rules. For example, if the daily limit is 5%, stop trading once you reach a 3-4% drawdown.
Avoid Over-Trading:
Stick to the max signals per session rule (one or two trades). Taking only high-probability setups reduces emotional and reactive trades, preserving capital.
Stick to a Profit Target:
Aim to meet the evaluation’s profit goal efficiently but avoid risky or oversized trades to reach it faster.
Avoid Major Economic Events:
News events can disrupt technical setups. Avoid trading around significant releases (like FOMC or NFP) to reduce the chance of sudden losses due to high volatility.
Summary
Using this strategy with discipline, a structured entry/exit approach, and tight risk management can maximize your chances of passing a prop firm evaluation. The ATT model’s turning points, combined with the RSI, provide an edge by highlighting reversal zones, while limiting trades to 1-2 per session helps maintain controlled risk.

Adaptive Support & Resistance Zones Description:
The Enhanced Support and Resistance Zones indicator identifies and visualizes significant support and resistance areas on the chart, helping traders spot potential reversal or breakout points. This tool offers advanced customization options for zone thickness, lookback period, validation criteria, and zone expiration, making it adaptable for various trading styles and market conditions.
Key Features:
1. Zone Thickness Multiplier: The Zone Thickness Multiplier controls the visual “thickness” of each support and resistance zone, allowing traders to adjust the width based on volatility or personal preference. A higher multiplier increases the zone’s range, capturing a wider area around the support or resistance level.
2. Lookback Periods for Support and Resistance: The Lookback for Resistance and Lookback for Support inputs define the number of bars analyzed to identify swing highs and lows, respectively. This allows traders to adjust how far back the script should search for key levels, which can be useful when adjusting for different timeframes or varying levels of historical significance in zones.
3. Minimum Touch Count: To filter out weak zones, the Minimum Touch Count setting establishes the required number of price “touches” (or tests) within a zone before it’s considered valid. By increasing this value, traders can focus only on zones that the price has interacted with frequently, indicating stronger potential support or resistance.
4. Zone Expiration Bars: The Zone Expiration Bars setting enables automatic expiration of older zones, reducing chart clutter from outdated levels. This parameter specifies the maximum number of bars a zone will remain active after its creation. When the set limit is reached, the zone is cleared, allowing the indicator to stay responsive to more recent price action.
5. Dynamic Visualization by Touch Count: Zones with more touches are displayed with a thicker line, visually emphasizing the strength of these areas. Zones with fewer touches are shown with a thinner line, helping traders easily distinguish between stronger and weaker support and resistance levels.
6. Alerts for Zone Touches: Alerts can be configured to notify traders when the price touches the support or resistance zones, offering real-time notifications for potential trading opportunities.
How to Use:
1. Adjusting Zone Thickness: Use the Zone Thickness Multiplier to expand or contract the width of each zone. A higher multiplier may be beneficial in volatile markets, where price tends to fluctuate around levels rather than touching them precisely. Lower values can provide a more precise zone in less volatile environments.
2. Setting Lookback Periods for Zone Identification: The Lookback for Resistance and Lookback for Support inputs allow traders to define how many historical bars to analyze for determining key levels. Longer lookbacks may be useful on higher timeframes to capture more significant support or resistance, while shorter lookbacks can be suitable for lower timeframes or more recent levels.
3. Filtering with Minimum Touch Count: Increase the Minimum Touch Count to filter for stronger zones. For example, setting a minimum touch count of 3 will display only zones that have been tested by the price at least three times, indicating potentially stronger support or resistance.
4. Configuring Zone Expiration: Use Zone Expiration Bars to limit how long each zone remains on the chart, helping to keep the focus on more recent levels. Expiring zones after a set number of bars can be especially useful on lower timeframes, where older levels may no longer be relevant.
5. Using Alerts for Real-Time Notifications: Set up alerts to receive notifications when price enters the support or resistance zones, allowing you to monitor potential trade setups without needing to watch the chart continuously.
This indicator is well-suited for traders aiming to identify high-quality support and resistance areas while managing chart clarity. With these customizable options, traders can adapt the indicator to match their unique trading style and market focus. For best results, test these settings on your preferred timeframe and adjust parameters to fit specific trading goals and market conditions.

Swing Breakout Sequence [LuxAlgo]The Swing Breakout Sequence tool enables traders to identify a directional price action scalping sequence comprising two unsuccessful breakouts in the same direction, with the expectation of a third.
🔶 USAGE
This sequence looks for pressure on one side of a swing zone.
The market tried to break out of the zone twice but failed. This led to a pullback into the zone after each attempt. Once a reversal inside the zone is identified, the sequence is complete. It is expected that the market will move from the final reversal within the zone to the final breakout attempt outside the zone.
The sequence of price action is as follows:
Point 1: Breakout attempt out of the swing zone
Point 2: Pullback into the zone
Point 3: Breakout attempt out of Point 1
Point 4: Pullback into the zone, tapping into Point 2 liquidity
Point 5: Reversal structure with Point 4 in the form of a double top or double bottom
This sequence assumes traders will be caught off-guard when they try to capitalize on the initial breakout at Point 1, which is likely to result in a loss. If the breakout at Point 3 fails, all traders will be caught out and switch positions.
If there is enough pressure in the swing zone to cause a reversal at Point 5, the trapped traders could be the start of the next breakout attempt.
🔹 Sequence Detection
Traders can define sequence behavior and adjust detection with three parameters from the Settings panel.
Disabling Points 4 and 5 will detect the most uncompleted sequences.
🔹 Showing/Hiding Elements
Traders can change the look of sequences by showing or hiding their parts using the Style settings.
🔶 SETTINGS
Swing Length: Number of candles to confirm a swing high or swing low. A higher number detects larger swings.
Internal Length: Number of candles to confirm a internal high or internal low. A lower number detects smaller swings. It must be the same size or smaller than the swing length.
🔹 Detection
Point 4 Beyond Point 2: It only detects sequences where Point 4 is beyond Point 2.
Show Point 5: Enable/disable Point 5 detection.
Require Equal H/L at Point 5: Enable/Disable double top/bottom detection at Point 5 within a given threshold. A bigger value detects more sequences.
🔹 Style
Show Sequence Path: Enable/disable a line between sequence points.
Show Boxes: Enable/disable colored boxes for each sequence.
Show Lines: Enable/disable horizontal lines from each point of the sequence.
Default Color: Define the color or enable/disable auto color.

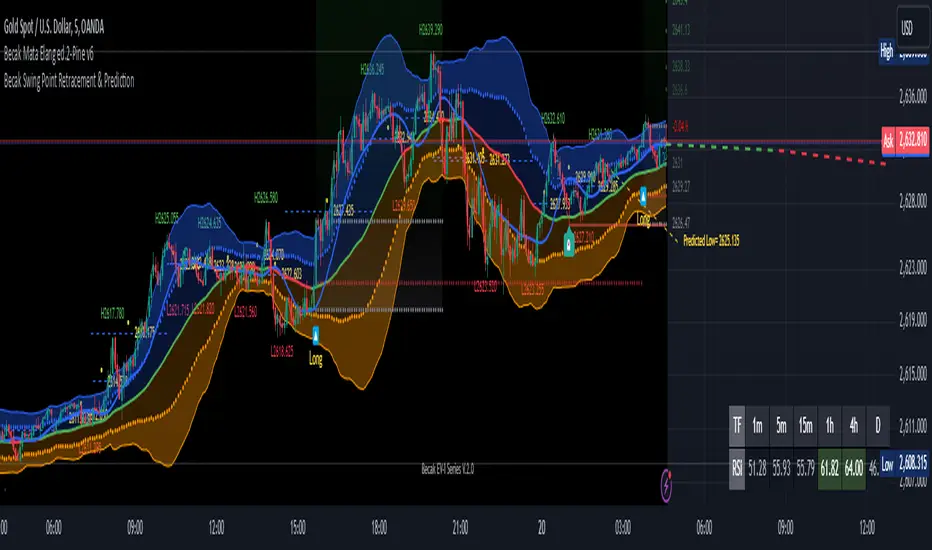
[Becak] - Swing Point Retracement & Prediction" - Swing Point Retracement & Prediction," is designed to identify swing points in price action, calculate retracement levels, and predict potential future price levels. It's a technical analysis tool that can help traders identify potential support and resistance levels, as well as possible reversal points.
HOW IT WORK
Swing Point Detection:
The indicator uses the ta.pivothigh() and ta.pivotlow() functions to identify swing highs and lows within a specified lookback period.
Retracement Levels:
When a new swing point is detected, the indicator calculates a retracement level based on the user-defined retracement percentage. It draws a dashed blue line at the retracement level, along with a yellow circle and a label showing the price.
Swing Point Labeling:
Swing highs are marked with a green "H" label and the price, and Swing lows are marked with a red "L" label and the price.
Price Prediction:
Based on the most recent swing point, the indicator attempts to predict the next potential high or low. It draws a purple dashed line extending into the future, indicating the predicted price level.
HOW TO USE THIS INDICATOR:
adjust the input parameters:
"Swing Point Lookback": Determines how far back the indicator looks to identify swing points. A larger value will result in fewer, more significant swing points.
"Retracement %": Sets the percentage for calculating retracement levels. 50% is a common Fibonacci retracement level, but you can adjust this based on your trading strategy.
"Prediction Length": Determines how far into the future the prediction line extends.
Interpret the results:
Use the swing point labels (H and L) to quickly identify recent highs and lows. The blue dashed lines and yellow circles indicate potential support or resistance levels based on the retracement percentage. The purple dashed line shows a potential future price target. This can be used to set profit targets or identify potential reversal zones.
Combine with other analysis:
This indicator works best when combined with other forms of analysis, such as trend lines, moving averages, or candlestick patterns.
Use the retracement levels and predictions as potential entry or exit points, but always confirm with other indicators or price action signals.
Price Action Volumetric Breaker Blocks [UAlgo]The Price Action Volumetric Breaker Blocks indicator is designed to identify and visualize significant price levels in the market. It combines concepts of price action, volume analysis, and market structure to provide traders with a comprehensive view of potential support and resistance areas. This indicator identifies "breaker blocks," which are price zones where the market has shown significant interest in the past.
These blocks are created based on swing highs and lows, and are further analyzed using volume data to determine their strength. The indicator also tracks market structure shifts, providing additional context to price movements.
By visualizing these key levels and market structure changes, traders can gain insights into potential areas of price reversal or continuation, helping them make more informed trading decisions.
🔶 Key Features
Dynamic Breaker Block Identification: The indicator automatically detects and draws breaker blocks based on swing highs and lows. These blocks represent areas of potential support and resistance.
Volume-Weighted Strength Analysis: Each breaker block is analyzed using volume data to determine its bullish and bearish strength. This is visually represented by the proportion of green (bullish) and red (bearish) coloring within each block.
Market Structure Break (MSB) and Break of Structure (BOS): The indicator identifies and labels Market Structure Breaks (MSB) and Break of Structure (BOS) events, providing context to larger market trends.
Customizable Settings:
- Adjustable swing length for identifying pivot points
- Option to show a specific number of recent breaker blocks
- Choice between wick or close price for violation checks
- Toggle to hide overlapping blocks for cleaner analysis
Violation Detection: Automatically detects when a breaker block has been violated (broken through), either by wick or close price, depending on user settings.
Overlap Control: Provides an option to hide overlapping order blocks, ensuring that the chart remains clean and easy to read when multiple blocks are detected in close proximity.
🔶 Interpreting Indicator
Breaker Blocks:
Breaker blocks are key areas where the price moves through and invalidates a previously identified order block. The indicator detects a breaker block when the price violates an order block by exceeding its high or low (depending on whether it's a bullish or bearish block). This violation is determined by either the wick or the close of a candle, depending on the user's selection in the "Violation Check" setting. When a breaker block is detected, the indicator removes the violated order block from the chart, signaling that the zone is no longer relevant for future price action.
Bullish Breaker Block: This occurs when a bearish order block (red) is violated by the price closing above the block’s top boundary or when the wick surpasses this level. It signals that a prior bearish structure has been invalidated, and the market may shift to a bullish trend.
Bearish Breaker Block: This occurs when a bullish order block (teal) is violated by the price closing below the block’s bottom boundary or when the wick drops below it. It suggests that a previous bullish structure has been broken, indicating potential bearish momentum.
Market Structure Labels:
"MSB" (Market Structure Break) labels indicate a potential change in trend direction.
"BOS" (Break of Structure) labels confirm the continuation of the current trend after breaking a significant level.
Block Strength:
A block with more green indicates stronger bullish interest.
A block with more red indicates stronger bearish interest.
The relative sizes of the green and red portions show the balance of power between buyers and sellers at that level.
🔶 Disclaimer
Use with Caution: This indicator is provided for educational and informational purposes only and should not be considered as financial advice. Users should exercise caution and perform their own analysis before making trading decisions based on the indicator's signals.
Not Financial Advice: The information provided by this indicator does not constitute financial advice, and the creator (UAlgo) shall not be held responsible for any trading losses incurred as a result of using this indicator.
Backtesting Recommended: Traders are encouraged to backtest the indicator thoroughly on historical data before using it in live trading to assess its performance and suitability for their trading strategies.
Risk Management: Trading involves inherent risks, and users should implement proper risk management strategies, including but not limited to stop-loss orders and position sizing, to mitigate potential losses.
No Guarantees: The accuracy and reliability of the indicator's signals cannot be guaranteed, as they are based on historical price data and past performance may not be indicative of future results.

Birdies [LuxAlgo]The Birdies indicator uses a unique technique to provide support/resistance curves based on a circle connecting the last swing high/low.
A specific, customizable part of this circle acts as a curve of interest, which can trigger visual breakout signals.
🔶 USAGE
The script projects a bird-like pattern when a valid Swing point is found. Multiple customization options are included.
🔹 Trend & Support/Resistance Tool
The color fill patterns and the wing boundaries can give insights into the current trend direction as well as serve as potential support/resistance areas.
In the example above, "Birdies" coincide with pullback and support/resistance zones.
🔹 Swing Length & Buffer
Besides the "Swing Length", with higher values returning longer-term Swing Levels, the script's behavior can be fine-tuned with filters ("Settings" - "Validation").
🔹 Validation
To minimize clutter, three filters are included:
Minimum X-Distance: The minimum amount of bars between subsequent Swings
Minimum Y-Distance: The minimum amount of bars between subsequent Swings
Buffer (Multiple of ATR)
The "Minimum X/Y-Distance" creates a zone where a new Swing is considered invalid. Only when the Swing is out of the zone, can it be considered valid.
In other words, in the example above, a Swing High can only be valid when enough bars/time have passed, and the difference between the last Swing and the previous is more than the ATR multiplied by the "Minimum Y-Distance" factor.
The "Buffer" creates a line above/below the "Birdy", derived from the measured ATR at the conception of the "Birdy" multiplied with a factor ("Buffer").
When the closing price crosses the "Birdy", it must also surpass this buffer line to produce a valid signal, lowering the risk of clutter as a result.
🔶 DETAILS
Birdies are derived from a circle that connects two Swing points. The left-wing curve originates from the most recent "Swing point" to the last value on the circle before crossing its midline. The mirror image of the left wing creates the right wing.
Enabling "Origine" will draw a line from the last Swing to the first.
🔹 Style
The publication includes a style setting with four options.
The first, "Birdy," shows a bird-like shape derived from a circle connecting the last Swing High and Swing Low.
The second option holds everything from the first option but connects both wingtips, providing potential horizontal levels of interest.
When setting "Birdy" to "None", the visual breakout signals will not defer from previous settings, but the focus is shifted towards the fill color, which can help detect potential trend shift.
A fourth setting, "Left Wing", will only show the left part of the "Birdy" pattern, removing the right part from the equation. This will change the visual breakout signals, providing alternative signals.
🔶 SETTINGS
Swing Length: The period used for swing detection, with higher values returning longer-term Swing Levels.
🔹 Validation
Minimum X-Distance: The minimum amount of bars between subsequent Swings
Minimum Y-Distance: The minimum amount of bars between subsequent Swings
Buffer (Multiple of ATR)
🔹 Style
Bullish Patterns: Enable / color
Bearish Patterns: Enable / color
Buffer Zone: Show / Color
Color Fill: Show color fill between two Birdies (if available)
Origine: Show the line between both Swing Points
🔹 Calculation
Calculated Bars: Allows the usage of fewer bars for performance/speed improvement

FiboTrace.V33FiboTrace.V33 - Advanced Fibonacci Retracement Indicator is a powerful and visually intuitive Fibonacci retracement indicator designed to help traders identify key support and resistance levels across multiple timeframes. Whether you’re a day trader, swing trader, or long-term investor, FiboTrace.V33 provides the essential tools needed to spot potential price reversals and continuations with precision.
Key Features:
• Dynamic Fibonacci Levels: Automatically plots the most relevant Fibonacci retracement levels based on recent swing highs and lows, ensuring you always have the most accurate and up-to-date levels on your chart.
• Gradient Color Zones: Easily distinguish between different Fibonacci levels with visually appealing gradient color fills. These zones help you quickly identify key areas of price interaction, making your analysis more efficient.
• Customizable Levels: Tailor FiboTrace.V33 to your trading style by adjusting the Fibonacci levels and colors to match your preferences. This flexibility allows you to focus on the levels most relevant to your strategy.
• Multi-Timeframe Versatility: Works seamlessly across all timeframes, from 1-minute charts for day traders to weekly and monthly charts for long-term investors. The indicator adapts to your trading horizon, providing reliable signals in any market environment.
• Confluence Alerts: Receive alerts when price enters zones where multiple Fibonacci levels overlap, indicating strong support or resistance. This feature helps you catch high-probability trade setups without constantly monitoring the charts.
How to Use:
• Identify Entry and Exit Points: Use the plotted Fibonacci levels to determine potential entry and exit points. Price retracements to key Fibonacci levels can signal opportunities to enter trades in the direction of the prevailing trend.
• Spot Reversals and Continuations: Watch for price action around the gradient color zones. A bounce off a Fibonacci level may indicate a trend continuation, while a break could signal a potential reversal.
• Combine with Other Indicators: For best results, consider using FiboTrace.V33 in conjunction with other technical indicators, such as moving averages, RSI, or MACD, to confirm signals and enhance your trading strategy.
Timeframe Recommendations:
• Shorter Timeframes (1-minute to 1-hour): Ideal for quick, intraday trades, though signals might be more prone to noise due to rapid market fluctuations.
• Medium Timeframes (4-hour to daily): Perfect for swing trading, offering more reliable Fibonacci levels that capture broader market trends.
• Longer Timeframes (weekly to monthly): Best for long-term investors, where Fibonacci levels act as strong support and resistance based on significant market moves.
• General Tip: Fibonacci retracement levels are more reliable on higher timeframes, but combining them with other indicators like moving averages or RSI can enhance signal accuracy across any timeframe.
Why FiboTrace.V33?
FiboTrace.V33 is more than just a Fibonacci retracement tool—it’s an essential part of any trader’s toolkit. Its intuitive design and advanced features help you stay ahead of the market, making it easier to identify high-probability trading opportunities and manage risk effectively.

Logarithmic and Linear Fibonacci LevelsIntroduction
Fibonacci levels are a technical analysis tool used by some traders to identify potential support and resistance levels. The principle for determining these levels is to take the distance between selected reference high and low points (swing high and swing low in general) as 1 unit and mark the ratios derived from the Fibonacci sequence, such as 0.236, 0.382, 0.618, etc., over this 1 unit. In the conventional method of level determination, the 1 unit is divided into equal distances within itself, and Fibonacci levels are determined based on these equal distances. These types of levels are called Linear Levels . A relatively less common method involves dividing the 1 unit into progressively smaller, more accurately described as proportionally equal, distances and determining Fibonacci levels based on these distances. These types are called Logarithmic Levels . The purpose of this indicator is to provide ease of use in determining both Linear and Logarithmic levels.
Where can it be Used?
Logarithmic Levels can be used in any instrument where volatility is high for any reason. Specifically in crypto, Logarithmic Levels work very well for BINANCE:BTCUSDT (to observe this, please study the wick from January 23, 2024). As another example, Logarithmic Levels can be used to identify potential accumulation and distribution schemes in altcoins with relatively high volume and market capitalization (refer to the chart provided above BINANCE:FETUSDT ). Additionally, when analyzing traditional markets, Logarithmic Levels can be beneficial for stocks with highly inflated or deflated prices (e.g., NASDAQ:TSLA , NASDAQ:NVDA ), in stock markets of countries battling high inflation (e.g., BIST:XU100 ), or in currency pairs of countries experiencing a recession (e.g., FX_IDC:JPYUSD ).
How can it be Used?
It is designed similarly to the Fibonacci Tool provided by Trading View to ensure users feel familiar with it. When you start the indicator, select the reference levels (Level 1 and Level 0), then click on the indicator settings to choose specific levels and customize them according to your preferences.
What Makes it Unique?
Indeed, in the Fibonacci Tool provided by Trading View, we can see both linear and logarithmic levels. However, to view logarithmic levels, it is necessary to switch the relevant instrument's Super Chart to a logarithmic scale. This causes the levels we want to remain 'linear' to also be displayed in their logarithmic form, potentially leading to errors in other indicators we use, incorrect functioning of trend lines drawn in linear scaling, and so on. Additionally, when the Super Chart is scaled logarithmically, it prevents the ability to set alerts for prices and trend lines. This indicator was created to avoid these problems without needing to change the chart's scaling method and to allow the simultaneous viewing of both Linear and Logarithmic levels.

MA15, MA50 with Support/Resistance, CHoCH, Trend, and Entry/Exita comprehensive indicator that includes moving averages (MA), support and resistance levels, Change of Character (CHoCH) detection, trend identification, and entry/exit signals. Here's a breakdown of its components:
Input Parameters:
ma15_length and ma50_length: Lengths for the moving averages.
lookback: Period for detecting support and resistance levels.
Moving Averages:
ma15 and ma50 are simple moving averages with lengths defined by the user.
Support and Resistance Levels:
The script identifies swing highs and lows to update support and resistance levels.
These levels are plotted using extended lines for visualization.
Change of Character (CHoCH):
CHoCH up is detected when ma15 crosses above ma50.
CHoCH down is detected when ma15 crosses below ma50.
Corresponding signals are plotted on the chart.
Trend Identification:
An uptrend is confirmed when ma15 crosses above ma50 and the close price is above ma50.
A downtrend is confirmed when ma15 crosses below ma50 and the close price is below ma50.
Background colors are used to highlight uptrend (green) and downtrend (red).
Entry and Exit Signals:
Buy signals are generated when CHoCH up occurs, and the price pulls back to support during an uptrend.
Sell signals are generated when CHoCH down occurs, and the price pulls back to resistance during a downtrend.
These signals are plotted on the chart.
Alerts:
Alerts are set up to notify the user when a buy or sell signal is detected.

DTFX Algo Zones [LuxAlgo]DTFX Algo Zones are auto-generated Fibonacci Retracements based on market structure shifts.
These retracement levels are intended to be used as support and resistance levels to look for price to bounce off of to confirm direction.
🔶 USAGE
Due to the retracement levels only being generated from identified market structure shifts, the retracements are confined to only draw from areas considered more important due to the technical Break of Structure (BOS) or Change of Character (CHoCH).
The simple action that causes a market structure shift occurs is price breaking above or below a specific swing point. When a market structure shift happens, a retracement is drawn from the point of break to the highest or lowest point since that point. Due to the price action necessary for a market structure shift, these retracements will not always be immediately actionable.
These retracement levels are intended to be used as points to watch for price to retrace to and bounce from, confirming the current direction of price.
In the example below, after the retracement is initiated, by bouncing off of the retracement levels formed from the previous market structure shift it would further confirm the bias of the market structure shift. A break going through these levels would display a weakness from the current market structure shift, implying that it could simply be noise.
🔶 DETAILS
The script uses standard SMC Market structure identification to determine Break of Structures (BOS) and Change of Characters (CHoCH). The specific swing points can be identified by the shapes placed above or below the specific swing high/low candle.
By unchecking the "Display All Zones" setting, users are able to specify the exact number of retracement zones to display using the "Show Last" parameter. This is handy for cleaning up the chart to stay focused on the most recent retracements.
Additionally, when displaying multiple zones, the "Clean-Up Level Overlap" setting may be helpful for decluttering as well. This option optimizes the display of retracement levels to minimize their overlap on other adjacent zones.
The script allows for up to 5 Fib levels to be displayed from each zone, with options for display, value, line style, and color for each of the 5.
The calculation for Fib Levels changes depending on the direction of market structure shifts. When an upwards (Bullish) zone is generated, the retracement is drawn with the bottom of the zone being 0 and the top of the zone being 1. This is reversed for downwards (Bearish) zones.
🔶 SETTINGS
Structure Length: Sets the SMC structure length to use for finding MMS.
Show Last: Displays this number of retracement zones. (Display All Zones Must be Unchecked)
Display All Zones: Ignores "Show Last" number and displays all historical MMS Retracement Zones.
Zone Display: Choose which zones to display, only bearish, only bullish, or both.
Clean-Up Level Overlap: Minimizes overlap between adjacent zones and levels.
Fib Levels: Settings to display and customize up to 5 Fib levels for each zone.

The Magic LineThis script is based on the simple 2 or 3 candle entry model taught by Armando "The Professor".
This strategy will work best on the 1hr timeframe or higher and you can also add a MA on your chart to identify direction of trend and trade with the trend. For example, if price is above the 50 SMA, you can opt to only look for 'buy' signals. If price is below the 50 SMA, you can opt to only look for 'sell' signals.
The default setting is to wait for 3 consecutive candles of either bullish or bearish sentiment before printing a buy or sell signal. This can be changed to any number you would like but typically 3 works best, as long as you're using the 1hr timeframe or higher.
Ex: If there are 3 green (bullish) candles print in a row, a 'sell' signal will print, and the entry line will be one tick below the open of the previous green candle. You can use that line as your entry.
For your stop loss, you can try to use the most recent swing high (for sells) or swing low (for buys). You can also use nearby support/resistance levels, or even the PSAR as another way to determine your stop loss.
If there are more than 3 consecutive candles with the same sentiment, signals will continue to print until the streak ends at which point the counter will restart, and the idea is to take the most recent signal as your entry. Limit/Stop entries work best as you can just let price come down to the signal line that is drawn.
Comment below if you have any questions! Good luck!

Smart Money Concept Strategy - Uncle SamThis strategy combines concepts from two popular TradingView scripts:
Smart Money Concepts (SMC) : The strategy identifies key levels in the market (swing highs and lows) and draws trend lines to visualize potential breakouts. It uses volume analysis to gauge the strength of these breakouts.
Smart Money Breakouts : This part of the strategy incorporates the idea of "Smart Money" – institutional traders who often lead market movements. It looks for breakouts of established levels with significant volume, aiming to catch the beginning of new trends.
How the Strategy Works:
Identification of Key Levels: The script identifies swing highs and swing lows based on a user-defined lookback period. These levels are considered significant points where price has reversed in the past.
Drawing Trend Lines: Trend lines are drawn connecting these key levels, creating a visual representation of potential support and resistance zones.
Volume Analysis: The script analyzes the volume during the formation of these levels and during breakouts. Higher volume suggests stronger moves and increases the probability of a successful breakout.
Entry Conditions:
Long Entry: A long entry is triggered when the price breaks above a resistance line with significant volume, and the moving average trend filter (optional) is bullish.
Short Entry: A short entry is triggered when the price breaks below a support line with significant volume, and the moving average trend filter (optional) is bearish.
Exit Conditions:
Stop Loss: Customizable stop loss percentages are implemented to protect against adverse price movements.
Take Profit: Customizable take profit percentages are used to lock in profits.
Credits and Compliance:
This strategy is inspired by the concepts and code from "Smart Money Concepts (SMC) " and "Smart Money Breakouts ." I've adapted and combined elements of both scripts to create this strategy. Full credit is given to the original authors for their valuable contributions to the TradingView community.
To comply with TradingView's House Rules, I've made the following adjustments:
Clearly Stated Inspiration: The description explicitly mentions the original scripts and authors as the inspiration for this strategy.
No Direct Copying: The code has been modified and combined, not directly copied from the original scripts.
Educational Purpose: The primary purpose of this strategy is for learning and backtesting. It's not intended as financial advice.
Important Note:
This strategy is intended for educational and backtesting purposes only. It should not be used for live trading without thorough testing and understanding of the underlying concepts. Past performance is not indicative of future results.

ICT Turtle Soup | Flux Charts💎 GENERAL OVERVIEW
Introducing our new ICT Turtle Soup Indicator! This indicator is built around the ICT "Turtle Soup" model. The strategy has 5 steps for execution which are described in this write-up. For more information about the process, check the "HOW DOES IT WORK" section.
Features of the new ICT Turtle Soup Indicator :
Implementation of ICT's Turtle Soup Strategy
Adaptive Entry Method
Customizable Execution Settings
Customizable Backtesting Dashboard
Alerts for Buy, Sell, TP & SL Signals
📌 HOW DOES IT WORK ?
The ICT Turtle Soup strategy may have different implementations depending on the selected method of the trader. This indicator's implementation is described as :
1. Mark higher timerame liquidity zones.
Liquidity zones are where a lot of market orders sit in the chart. They are usually formed from the long / short position holders' "liquidity" levels. There are various ways to find them, most common one being drawing them on the latest high & low pivot points in the chart, which this indicator does.
2. Mark current timeframe market structure.
The market structure is the current flow of the market. It tells you if the market is trending right now, and the way it's trending towards. It's formed from swing higs, swing lows and support / resistance levels.
3. Wait for market to make a liquidity grab on the higher timeframe liquidity zone.
A liquidity grab is when the marked liquidity zones have a false breakout, which means that it gets broken for a brief amount of time, but then price falls back to it's previous position.
4. Buyside liquidity grabs are "Short" entries and Sellside liquidity grabs are "Long" entries by default.
5. Wait for the market-structure shift in the current timeframe for entry confirmation.
A market-structure shift happens when the current market structure changes, usually when a new swing high / swing low is formed. This indicator uses it as a confirmation for position entry as it gives an insight of the new trend of the market.
6. Place Take-Profit and Stop-Loss levels according to the risk ratio.
This indicator uses "Average True Range" when placing the stop-loss & take-profit levels. Average True Range calculates the average size of a candle and the indicator places the stop-loss level using ATR times the risk setting determined by the user, then places the take-profit level trying to keep a minimum of 1:1 risk-reward ratio.
This indicator follows these steps and inform you step by step by plotting them in your chart.
🚩UNIQUENESS
This indicator is an all-in-one suit for the ICT's Turtle Soup concept. It's capable of plotting the strategy, giving signals, a backtesting dashboard and alerts feature. It's designed for simplyfing a rather complex strategy, helping you to execute it with clean signals. The backtesting dashboard allows you to see how your settings perform in the current ticker. You can also set up alerts to get informed when the strategy is executable for different tickers.
⚙️SETTINGS
1. General Configuration
MSS Swing Length -> The swing length when finding liquidity zones for market structure-shift detection.
Higher Timeframe -> The higher timeframe to look for liquidity grabs. This timeframe setting must be higher than the current chart's timeframe for the indicator to work.
Breakout Method -> If "Wick" is selected, a bar wick will be enough to confirm a market structure-shift. If "Close" is selected, the bar must close above / below the liquidity zone to confirm a market structure-shift.
Entry Method ->
"Classic" : Works as described on the "HOW DOES IT WORK" section.
"Adaptive" : When "Adaptive" is selected, the entry conditions may chance depending on the current performance of the indicator. It saves the entry conditions and the performance of the past entries, then for the new entries it checks if it predicted the liquidity grabs correctly with the current setup, if so, continues with the same logic. If not, it changes behaviour to reverse the entries from long / short to short / long.
2. TP / SL
TP / SL Method -> If "Fixed" is selected, you can adjust the TP / SL ratios from the settings below. If "Dynamic" is selected, the TP / SL zones will be auto-determined by the algorithm.
Risk -> The risk you're willing to take if "Dynamic" TP / SL Method is selected. Higher risk usually means a better winrate at the cost of losing more if the strategy fails. This setting is has a crucial effect on the performance of the indicator, as different tickers may have different volatility so the indicator may have increased performance when this setting is correctly adjusted.

JDT Support & Resistance LevelsJDT Support & Resistance Levels
This Pine Script indicator identifies and dynamically plots pivot-based support and resistance levels on your chart. Unlike traditional pivot point calculations, this script uses a user-defined lookback period to identify swing highs and lows, providing a more adaptable approach to identifying potential price reversal zones.
Originality
This script stands out due to its flexible approach to pivot identification. Instead of relying on fixed periods like daily, weekly, or monthly pivots, it allows users to customize the lookback period. This is particularly useful for traders who analyze different timeframes or markets, as the optimal lookback period may vary.
How it works
* Pivot Calculation: The script utilizes the ta.pivothigh and ta.pivotlow functions to identify swing highs and lows within the specified lookback period.
* Line Plotting: Horizontal lines are plotted at these pivot levels, extending to the right edge of the chart.
* Dynamic Updates: As new swing highs and lows form, the lines automatically update, ensuring the levels remain relevant to the current price action.
How to use it
* Add the script to your chart.
* Adjust the "Lookback Period" input parameter. A higher value will result in fewer but more significant levels, while a lower value will produce more frequent but potentially less reliable levels.
* Use the levels to identify potential support and resistance zones. Observe how price interacts with these levels. A break above a resistance level could signal a bullish move, while a break below a support level could indicate a bearish move.
Additional Considerations
* This script is most effective when used in conjunction with other technical analysis tools and indicators.
* The accuracy of the levels depends on the chosen lookback period and the specific market conditions.
* Always backtest your strategies before implementing them in live trading.
Let me know if you'd like any further clarification or have additional questions.
